Energy production in January and February 2024:Coal production cuts, oil, gas and power grow steadily
On March 18, the National Bureau of Statistics released the energy production situation from January to February 2024. From January to February, raw coal production in industries above designated size (hereinafter referred to as industries above designated size) declined, and crude oil, natural gas, and power production increased steadily.
following is the original text
1-2 In March, raw coal production in industries above designated size (hereinafter referred to as industries above designated size) declined, while production of crude oil, natural gas and electricity increased steadily.
1. Production of raw coal, crude oil and natural gas and related conditions
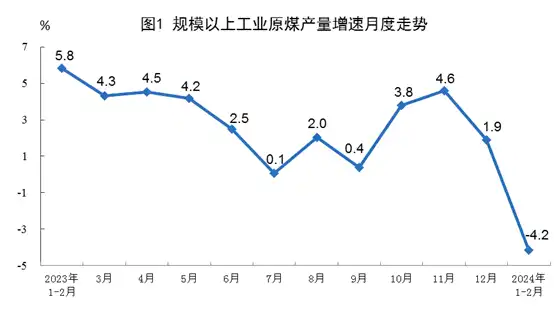
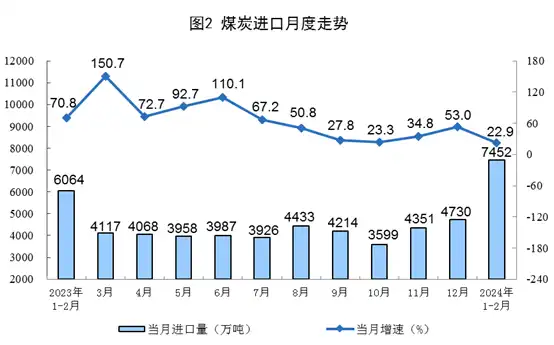
Raw coal production declined, and imports grew rapidly. 1-2 In January, industrial raw coal output above designated size was 710 million tons, a year-on-year decrease of 4.2%. In December of last year, it increased by 1.9%; the average daily output was 11.75 million tons. Imported coal was 74.52 million tons, a year-on-year increase of 22.9%, and continued to maintain rapid growth.
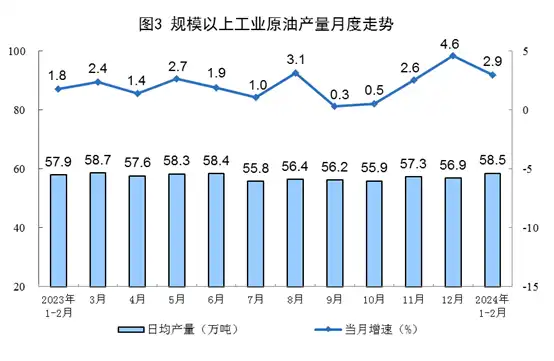
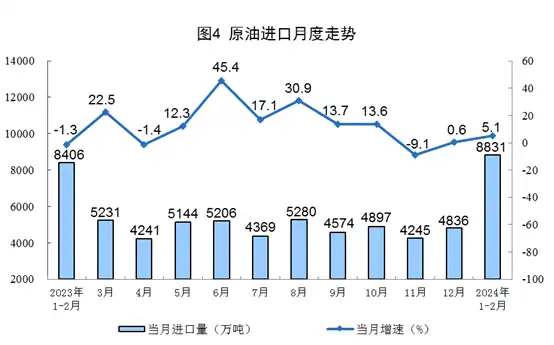
Crude oil production grew steadily and import growth accelerated. 1-2 In March, the output of industrial crude oil above designated size was 35.11 million tons, a year-on-year increase of 2.9%. The growth rate slowed down by 1.7 percentage points from December of last year; the average daily output was 585,000 tons. Imported crude oil was 88.31 million tons, a year-on-year increase of 5.1%, and the growth rate was 4.5 percentage points faster than in December last year.
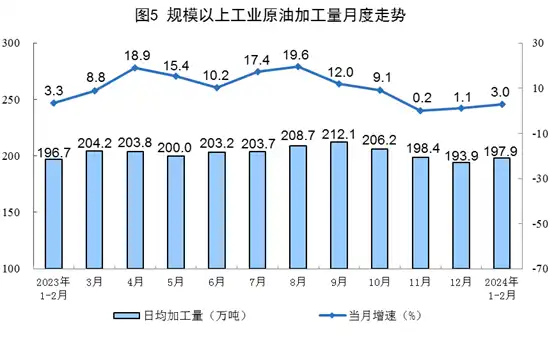
The growth rate of crude oil processing has accelerated. 1-2 In March, the processing volume of industrial crude oil above designated size was 118.76 million tons, a year-on-year increase of 3.0%, and the growth rate was 1.9 percentage points faster than that in December of last year; the average daily processing volume was 1.979 million tons.
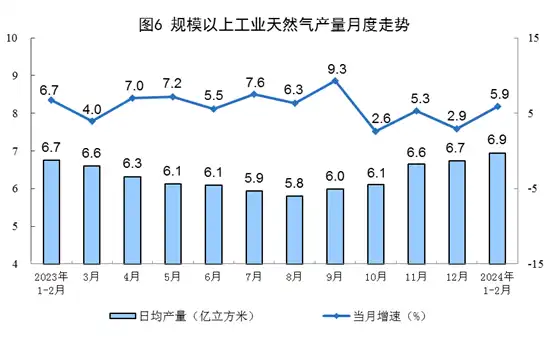
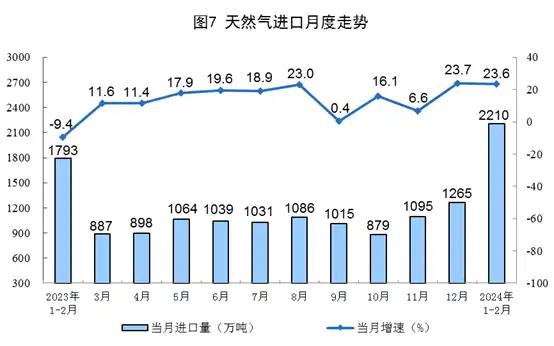
The growth rate of natural gas production accelerated, and imports maintained rapid growth. 1-2 In March, industrial natural gas output above designated size was 41.7 billion cubic meters, a year-on-year increase of 5.9%, and the growth rate was 3.0 percentage points faster than in December of last year; the average daily output was 690 million cubic meters. Imported natural gas was 22.1 million tons, a year-on-year increase of 23.6%, and the growth rate slowed down by 0.1 percentage points compared with December last year.
2. Electricity production
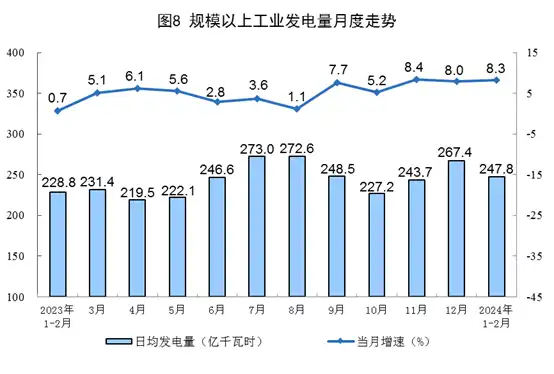
Electricity production remained stable. 1-2 In January, the industrial power generation capacity above designated size was 1.487 billion kilowatt-hours, a year-on-year increase of 8.3%, and the growth rate was 0.3 percentage points faster than in December of last year; the average daily power generation was 24.78 billion kilowatt-hours.
In terms of varieties, from January to February, the growth rate of industrial thermal power above designated size accelerated, the growth rate of hydropower, wind power, and solar power generation slowed down, and nuclear power shifted from decline to increase. Among them, industrial thermal power above designated size increased by 9.7%, and the growth rate was 0.4 percentage points faster than that in December of last year; industrial hydropower above designated size increased by 0.8%, and the growth rate slowed down by 1.7 percentage points; industrial nuclear power above designated size increased by 3.5%, last year. In December, it fell by 4.2%; industrial wind power above designated size increased by 5.8%, with the growth rate slowing down by 1.6 percentage points; industrial solar power above designated size increased by 15.4%, with the growth rate slowing down by 1.8 percentage points.
note
1. Indicator interpretation
Average daily product output:It is calculated by dividing the total output of industrial enterprises above designated size announced in the month by the calendar days of the month.
2. statistical scope
The statistical standards of output data in the report are all for industries above designated size, and their statistical scope is industrial enterprises with annual main business income of 20 million yuan or more.
Since the scope of industrial enterprises above designated size changes every year, in order to ensure that this year's data is comparable with the previous year, the corresponding period used to calculate the year-on-year growth rate of various indicators such as product output is consistent with the enterprise statistical range of this period and the data released in the previous year. There are differences in caliber.
3. data sources
Import data comes from the General Administration of Customs, and the data from January to February 2024 are flash data.
4. Natural gas unit conversion relationship:1 ton is approximately equal to 1380 cubic meters.
